 Each year the Healthy Marriage grantees serve a diverse group of participants across the United States. Since the beginning of the OMB approved data collection in 2012, HM participants have been characterize by a high degree of diversity in all of the demographic variables – age, sex, marital status, employment status.
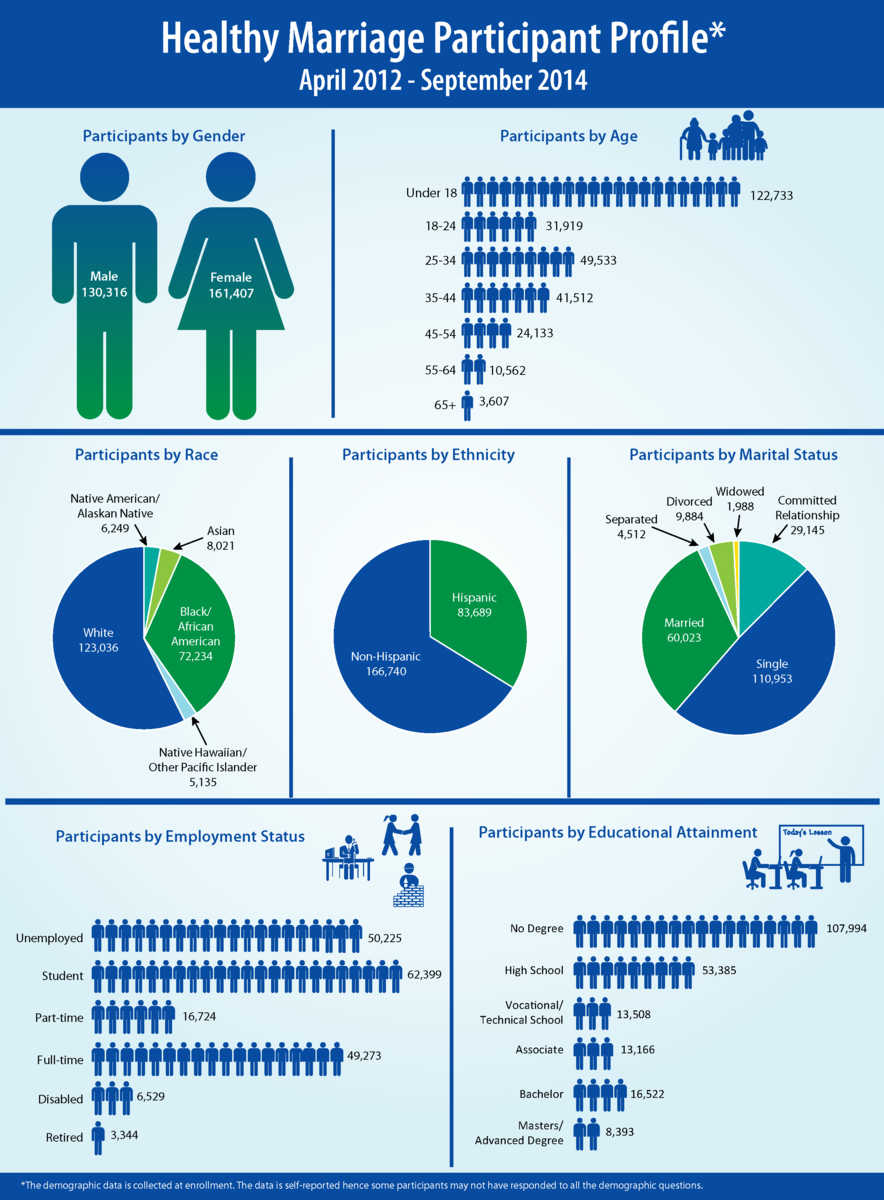
 By Sex, there were 130,316 males and 161,407 females.
By Age, there were 122,733 under 18 years., 31,919 between 18 years – 24 years, 49,533 between 25 years – 34 years, 41,512 between 35 years – 44 years, 24,133 between 45 years – 54 years, 10,562 between 55 years – 64 years and 3,607 who were 65 years or older.
By Race, there were 6,249 who identified themselves as Native American/Alaskan Native; 8,021 Asian; 72,234 Black/African American; 5,135 Native Hawaiian/Other Pacific Islander; and 123,036 White.
By Ethnicity, there are 83,689 Hispanics and 166,740 Non-Hispanic.
By Marital Status, 110,953 indicated they were single, 29,145 were in a committed relationship, 60,023 were married, 4,512 were separated, 9,884 were divorced and 1,988 were widowed.
By Employment Status, 50,225 indicated they were unemployed, 62,399 were students, 3,344 retired, 16,724 had part-time employment, 49,273 had full-time employment and 6,529 were disabled.